Dashboard
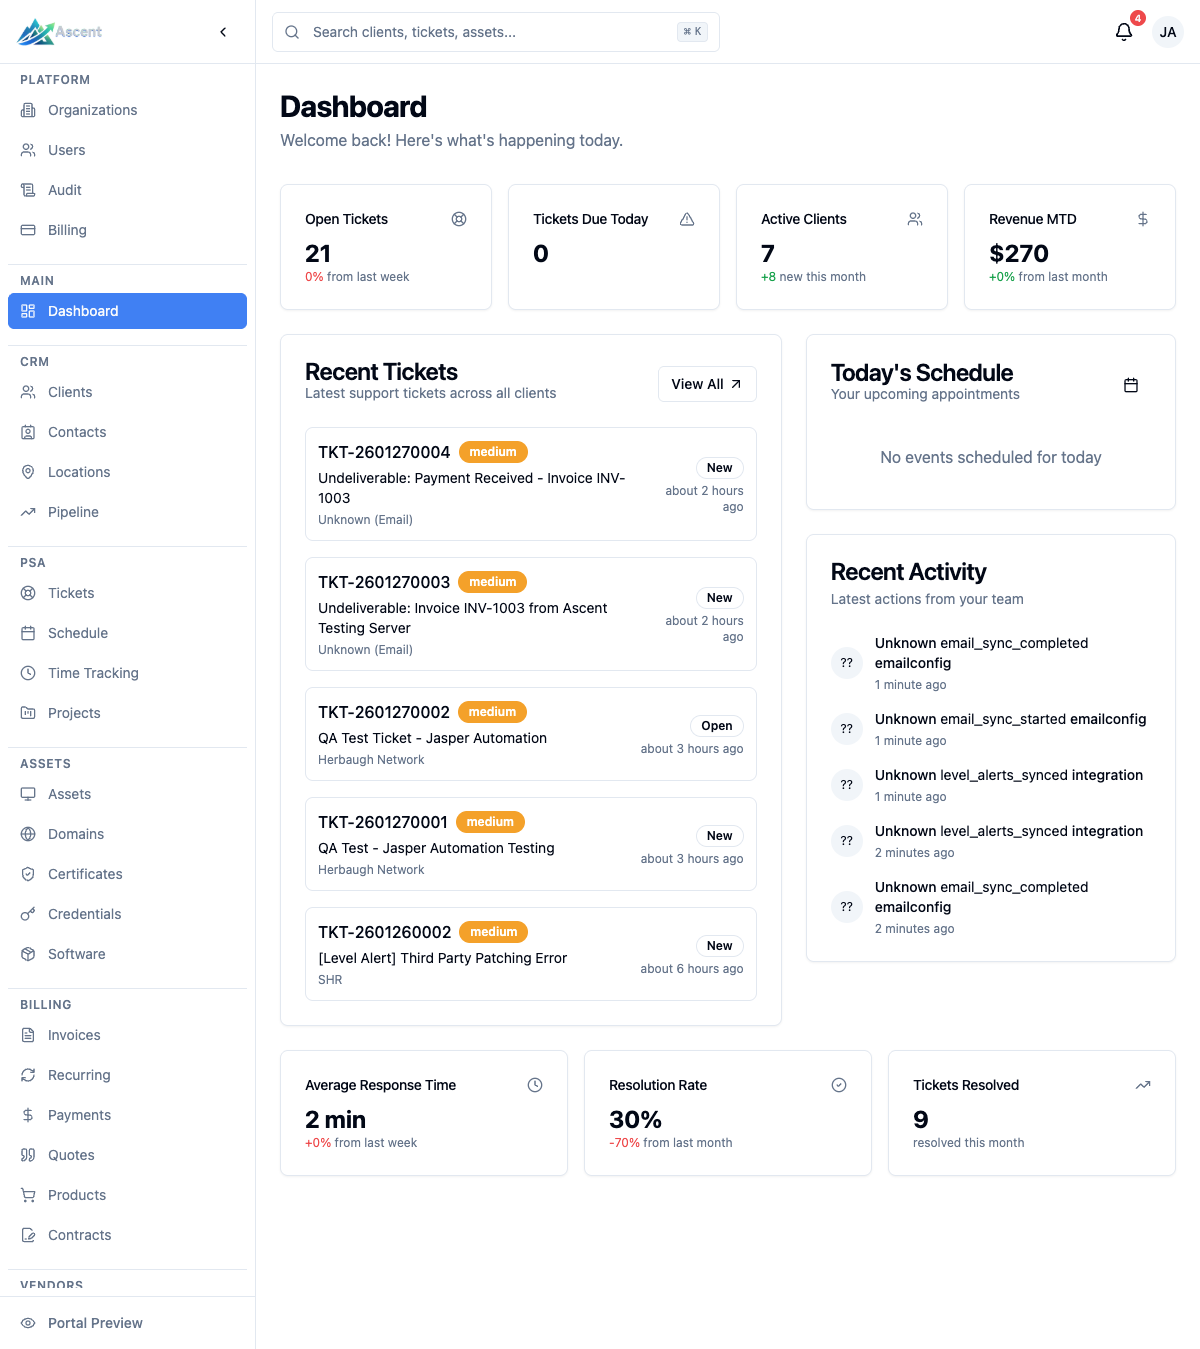
The Dashboard is the landing page of Ascent, giving you an at-a-glance view of tickets, schedule, recent activity, and—if you have the right permissions—org-wide stats and financials.
Overview
The Dashboard lets you:
- See a stats grid that adapts to your role (org-wide metrics for managers, personal metrics for everyone else)
- Track ticket performance with quick stats for response time, resolution rate, and tickets resolved
- Review the most recent tickets across all clients
- Check today's calendar events alongside tickets due today
- Follow recent activity from the audit log
- Monitor current-month profit and loss (managers with reporting and billing access)
Navigate to the Dashboard
The Dashboard is the home page. Select Dashboard at the top of the left sidebar, or browse to /.
What you see depends on your permissions
The Dashboard renders different sections based on your role and permissions. The top stats grid switches between a manager view and a personal view:
| View | Who sees it | What it shows |
|---|---|---|
| Manager view | Users with reports.read, invoices.read, and clients.read | Four org-wide cards: Open Tickets, Tickets Due Today, Active Clients, Revenue MTD |
| Personal view | Everyone else | Two cards scoped to your assigned tickets: My Open Tickets, My Tickets Due Today |
Visibility is driven entirely by your permissions, not your role directly. With the default role permissions, Owners and Admins have all three required permissions and see the manager view, while Members lack reports.read and see the personal view. A custom role that grants or removes these permissions changes what you see.
Stats grid
Manager view (org-wide)
| Card | Value | Trend / detail |
|---|---|---|
| Open Tickets | Count of tickets whose status is not closed | Percentage change vs. last week (fewer tickets shows as a positive trend) |
| Tickets Due Today | Open tickets with a due date today | Shows how many of those are high priority |
| Active Clients | Clients with status ACTIVE | Number of clients added this month |
| Revenue MTD | Amount paid on invoices this month (status PAID or PARTIAL) | Percentage change vs. last month |
Personal view
| Card | Value | Trend / detail |
|---|---|---|
| My Open Tickets | Open tickets assigned to you | Percentage change vs. last week |
| My Tickets Due Today | Your open tickets due today | Shows how many are high priority |
Quick stats
Below the stats grid, three cards summarize ticket performance for the organization:
| Card | Value | Detail |
|---|---|---|
| Average Response Time | Average minutes to first response on tickets created in the last week | Percentage change vs. the prior week |
| Resolution Rate | Tickets resolved as a percentage of tickets created this week | Percentage-point change vs. the prior week (labeled "from last month" in the app) |
| Tickets Resolved | Count of customer feedback (CSAT) responses submitted this month (labeled "resolved this month" in the app) | — |
Recent Tickets
The main panel lists the five most recently created tickets across all clients that are not closed (including any without a status set). Each row shows the ticket number (formatted as TKT-0000), a priority badge, the subject, the client name, the current status (defaulting to Open when none is set), and how long ago it was created. Selecting a row opens the ticket. Use View All to go to the full ticket list at /tickets.
Priority is shown with a colored badge: critical and high are red, medium is yellow/amber, and low is a neutral badge.
Today's Schedule
This panel combines two things for the current day:
- Calendar events that start today or all-day events that overlap today, each showing the title, optional location, and start time (or "All day").
- Tickets due today, showing the ticket number, subject, client, priority badge, and due time.
Calendar events are always drawn from across the organization. The tickets-due list, however, is scoped: managers see all org-wide tickets due today, while other users see only tickets assigned to them. The panel description reads "Appointments and tickets due today" for users with audit access and "Your appointments and tickets due today" for everyone else. Use the calendar icon in the header to open the calendar. When there is nothing scheduled, the panel reads "No events or tickets scheduled for today."
Recent Activity
A feed of the latest actions drawn from the audit log. Each entry shows who performed the action (or "System" for automated events, such as Level RMM webhook activity), a plain-language description of the action, and how long ago it happened.
Managers (Owners and Admins) see activity from across the organization, while other users see only their own recent actions. The panel description reflects your audit permission: users with audit.read see the heading "Latest actions from your team", and everyone else sees "Your recent actions".
Profit & Loss widget
Managers with both reporting (reports.read) and billing (invoices.read) access see a Profit & Loss widget for the current month. It shows:
- Net Profit/Loss for the month, with the percentage change vs. last month
- A Revenue and Expenses breakdown
- A Profit Margin percentage with a progress bar
Use the arrow in the widget header to open the full Profit & Loss report at /reports/profit-loss.
Custom Dashboards
On the Teams and Enterprise plans you can build your own dashboard from a catalog of widgets instead of using the built-in layout. Custom dashboards are per-user: your layout is yours alone and never changes what anyone else sees.
If your plan does not include custom dashboards, the Customize entry point is hidden and you always see the built-in dashboard described above.
Switch to a custom layout
- From the Dashboard, select Customize.
- Add widgets from the catalog, drag to reorder them, and set each widget's width.
- Your changes are saved to your account, so the next time you open the Dashboard your custom layout loads automatically.
Until you customize anything, the Dashboard shows the standard built-in layout. Once you save a layout, that layout becomes your Dashboard.
Widget catalog
The catalog offers nine widgets, grouped by category. The widgets reuse the same data the rest of Ascent already shows, so the numbers always match the corresponding pages.
| Widget | Category | What it shows | Configurable period |
|---|---|---|---|
| Key Stats | Overview | Open tickets, due today, active clients, and revenue at a glance | No |
| My Work | Overview | Your open tickets and what is due today | No |
| Due Today | Tickets | Tickets with an SLA due date of today | No |
| Recent Tickets | Tickets | The most recently created tickets | No |
| Recent Activity | Activity | Latest audited actions across the organization | No |
| Ticket Volume | Analytics | Ticket volume trend over the selected period | Yes |
| SLA Health | Analytics | Response and resolution compliance over the selected period | Yes |
| Team Utilization | Analytics | Average utilization and billable hours over the selected period | Yes |
| Client Health | Analytics | Distribution of client health scores over the selected period | Yes |
Widgets that support a period let you choose from 7 days, 30 days, 90 days, 12 months, or year to date.
Each widget can be sized to span 1, 2, or 3 columns in the responsive three-column grid; widgets flow left to right in the order you arrange them.
Widgets respect your permissions
The catalog only offers widgets you are allowed to see, and a widget's data always honours your permissions:
| Widget | Permission required to add and view |
|---|---|
| Key Stats, My Work, Recent Activity | Dashboard access |
| Due Today, Recent Tickets | tickets.read |
| Ticket Volume, SLA Health, Team Utilization, Client Health | reports.read |
If you lack a permission, the matching widget never appears in the catalog, and analytics or financial data is never exposed to a role that is not permitted to see it. A custom role that grants or removes these permissions changes which widgets you can add.
Reset to the default
To go back to the built-in dashboard, remove your saved layout from the customize view. This deletes only your personal layout and reverts your Dashboard to the standard built-in view—it does not affect anyone else.
Tips
- If the manager stats grid does not appear, you are missing one of the required permissions (
reports.read,invoices.read, orclients.read). Ask an Owner or Admin to adjust your role under Admin → Roles & Permissions. - The Open Tickets and My Open Tickets trends treat a decrease as positive—fewer open tickets is a good thing, so a drop is shown in green.
- Recent Tickets and Today's Schedule each surface up to five items; use View All or the linked pages to see the rest.
- Custom dashboards are a Teams and Enterprise feature. If you don't see Customize, your plan does not include it, or ask an Owner to review your license tier under Settings → Billing.